TargetProcess Burndown
TargetProcess Burndown widget for Dashing-JS
View the Project on GitHub kj187/dashing-targetprocess_burndown
TargetProcess burndown widget
Author: Julian Kleinhans · Blog: http://blog.kj187.de
Dashing-JS is a NodeJS port of Dashing, an Sinatra based framework that lets you build beautiful dashboards.
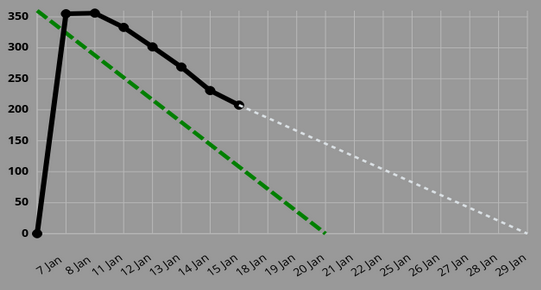
The TargetProcess burndown widget is a graphical representation of work left to do versus time. Due to the fact that TargetProcess doesn`t provide an API for reports like a burndown chart, we will use a other smart technologie - screenshots :-) The npm package "webshot" provides a simple API for taking webpage screenshots. So, all you need is a TargetProcess dashboard with a configured burndown chart.
Preview

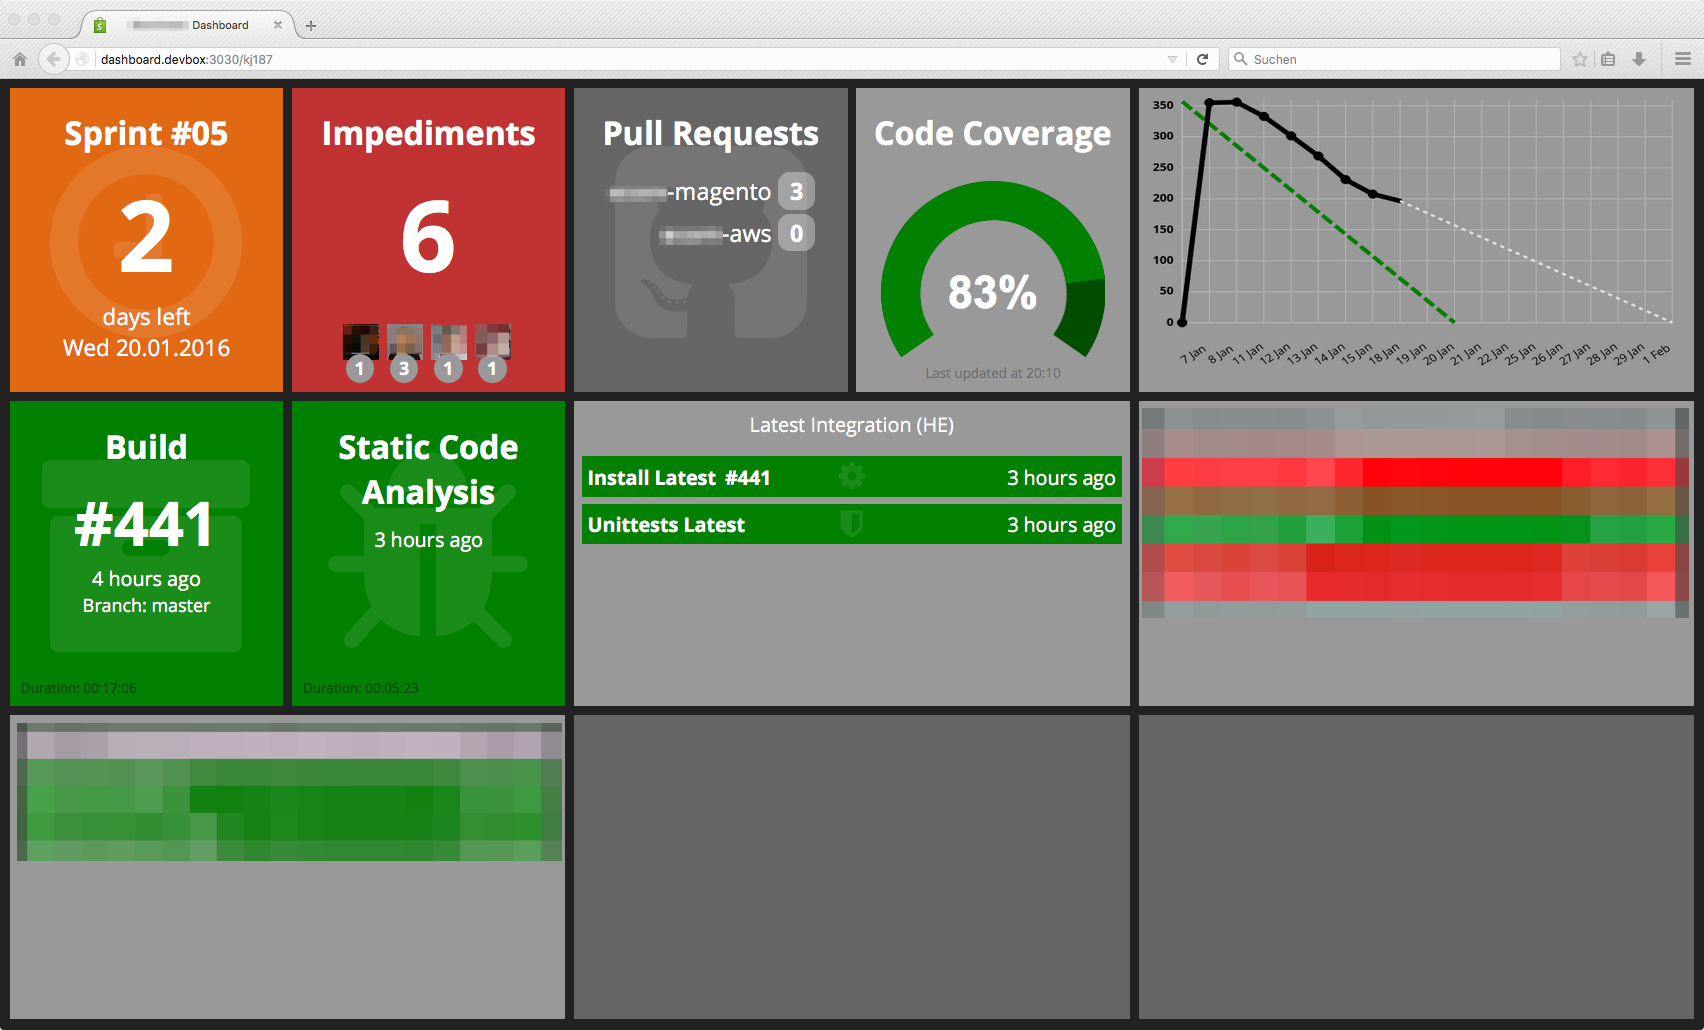
Example Dashboard

Requirements
$ npm install -g dashing-js
Widget dependencies
$ npm install tp-api
$ npm install cron
$ npm install webshot
$ npm install btoa
You need also PhantomJS in version 2.x, the dependency version of webshot is 1.x and this version has a bug regarding SVG images. You can install PhantomJS 2.x as the following:
Furthermore a TargetProcess dashboard with a configured burndown chart is required!
cd /tmp
wget https://github.com/kj187/phantomjs-2.0.0-linux-x86_64/raw/master/phantomjs-2.0.0-linux-x86_64.tar.bz2
tar -jxf phantomjs-2.0.0-linux-x86_64.tar.bz2
sudo cp /tmp/phantomjs-2.0.0-linux-x86_64/bin/phantomjs /usr/local/bin/
Installation
$ dashing-js install https://github.com/kj187/dashing-targetprocess_burndown/archive/master.zipCreate a new directory config on your root directory.
Move the widgets/targetprocess_burndown/config.targetprocess_burndown.sample.js file to this directory and rename it to config.targetprocess_burndown.js.
assets/
  ...
config/
  config.targetprocess_burndown.js
  ...
dashboards/
  ...
jobs/
  ...
...
Usage
To include the widget on your dashboard, add the following snippet to the dashboard layout file:
<li data-row="1" data-col="1" data-sizex="1" data-sizey="1">
  <div data-id="targetprocess_burndown" data-view="TargetprocessBurndown"></div>
</li>
Or if you use Jade as your favorite template engine
li(data-row='1', data-col='1', data-sizex='1', data-sizey='1')
  div(data-id='targetprocess_burndown', data-view='TargetprocessBurndown', class='widget')
Settings
module.exports = {

    eventName: 'targetprocess_burndown',
    cronInterval: '1 * * * * *',
    publicLocalImagePath: 'images/burndown/iteration_burndown.png',

    client: {
        host: 'www.host.com/',
        protocol: 'https',
        pathToBurnDown: 'RestUI/Board.aspx?acid=12345#page=dashboard/12345&appConfig=12345==',
        username:'targetProcessUsername',
        password: 'targetProcessPasswordUnfortunatelyInPlaintext'
    },

    options: {
        quality: 100,
        renderDelay: 7000,
        screenSize: {
            width: 1600,
            height: 768
        },
        phantomPath: '/usr/local/bin/phantomjs',
        captureSelector: '#dashboard-column-0 svg',
        customCSS: '.burnDownReport svg{background:#999!important}.burnDownReport svg text{font-size:14px!important;fill:#000!important}.burnDownReport .xLabel{fill:#000!important}.burnDownReport line.xLine,line.xAxis,line.yAxis,line.yLine{stroke:#B9B9B9!important;stroke-width:1!important}.burnDownReport line.idealLine{stroke:green!important;stroke-width:5px!important;stroke-dasharray:15,5!important}.burnDownReport line.lineChart{stroke:#000!important;stroke-linecap:round!important;stroke-width:6px!important}.burnDownReport circle.lineChartPoint{stroke:#000!important;fill:#000!important;stroke-width:4px!important}'
    }
}
Global settings
| Setting | Example | Description |
|---|---|---|
| eventName | github_pullrequests | Event name, must be the same as the data-id attribute |
| cronInterval | 1 * * * * * | Click here for available cron patterns |
| publicLocalImagePath | images/burndown/iteration_burndown.png | Subdirectory of public/ directory |
client settings
| Setting | Example | Description |
|---|---|---|
| host | www.host.com | Host of your TargetProcess |
| protocol | https | Http or https |
| pathToBurnDown | RestUI/Board.aspx?acid=12345#page=dashboard/12345&appConfig=12345== | Path to the page where the burndown widget is |
| username | julian.kleinhans | Username for authentification |
| password | xxxxxxx | Password for authentification. Unfortunately this must be an plaintext password |
options settings
You can use all webshot options.
| Setting | Example | Description |
|---|---|---|
| quality | 100 | JPEG compression quality. A higher number will look better, but creates a larger file. Quality setting has no effect when streaming |
| renderDelay | 7000 | Number of milliseconds to wait after a page loads before taking the screenshot |
| screenSize | { width: 1600, height: 768 } | The dimensions of the browser window |
| phantomPath | /usr/local/bin/phantomjs | The location of PhantomJS 2.x |
| captureSelector | #dashboard-column-0 svg | Captures the page area containing the provided selector and saves it to file |
| customCSS | .burnDownReport svg{background:#999!important} ... | When taking the screenshot, adds custom CSS rules if defined |
Layout
If you want to change the layout, adjust the follwing style, use https://cssminifier.com to convert the styles to a one-liner and add this one-liner to the customCSS option.
 .burnDownReport svg {
    background: #999999 !important;
}

 .burnDownReport svg text {
    font-size: 14px !important;
    fill: #000 !important;
}

 .burnDownReport .xLabel {
    fill: #000000 !important;
}

 .burnDownReport line.xLine, line.xAxis, line.yAxis, line.yLine {
    stroke: #B9B9B9 !important;
    stroke-width: 1 !important;
}

 .burnDownReport line.idealLine {
    stroke: #008000 !important;
    stroke-width: 5px !important;
    stroke-dasharray: 15,5 !important;
}

 .burnDownReport line.lineChart {
    stroke: #000000 !important;
    stroke-linecap: round !important;
    stroke-width: 6px !important;
}

 .burnDownReport circle.lineChartPoint {
    stroke: #000000 !important;
    fill: #000000 !important;
    stroke-width: 4px !important;
}
Changelog
release-1.0.0
- First release
Other Dashing-JS widgets
Do you know that I also created some other Dashing-JS widgets? Try out