
PostgreSQL & HA
This is the canonical guide to running Jarvis against PostgreSQL and scaling it to several replicas. Every other doc that touches this topic (README.md, charts/jarvis/README.md, docs/features.md, docs/retention.md, docs/alert-lifecycle.md) links here instead of restating it.
SQLite is the default and requires zero setup — use it for testing, evaluation, and homelab-scale single-replica deployments. For production, high availability, horizontal scaling, and long-term stability, use PostgreSQL. See Why SQLite stays single-replica for the reasoning.
Configuration
One environment variable selects both the dialect and the connection:
JARVIS_DB_DSN=/data/jarvis.db
# or
JARVIS_DB_DSN=postgres://jarvis:secret@postgres:5432/jarvis?sslmode=require- Dialect auto-detection: a
postgres://orpostgresql://prefix selects PostgreSQL; anything else is treated as a SQLite file path. No separate "which database" setting exists. - Migrations run automatically on every startup and are idempotent — safe to restart, safe to upgrade in place. Both dialects are kept in schema parity (
internal/db/migrate_sqlite.go/migrate_postgres.go); PostgreSQL additionally has one dialect-only table,poll_snapshots(see Leader-only polling & snapshot distribution below) — SQLite never creates or reads it, since it never has followers to feed. On PostgreSQL, every pod runs migrations on startup — before leader election even begins — so the whole statement list is wrapped in a session-level advisory lock (pg_advisory_lock, class ID0x4A525653same as leader election, lock ID2so it can never collide with the leader-election lock's ID1) held on a dedicated connection. Without it, two pods racingCREATE TABLE IF NOT EXISTSduring a rolling deploy can both lose the race to PostgreSQL's own catalog uniqueness check and crash. - TLS: use
sslmode=require(orsslmode=verify-fullwith a CA certificate) in production.sslmode=disabletransmits the database password in plain text and must never be used outside a local, ephemeral test container. - Redaction: the password in
JARVIS_DB_DSNis redacted (db.RedactDSN) before it ever reaches a log line — the raw DSN is never logged. - Connection-pool cap:
JARVIS_DB_MAX_OPEN_CONNS(default10) caps the PostgreSQL pool per pod; idle connections are kept up to the same cap so request bursts reuse connections instead of churning them (ConnMaxLifetime=30m,ConnMaxIdleTime=5m). Each pod additionally holds one dedicated connection for leader election and one for the LISTEN/NOTIFY WS fanout. Size it soreplicas × (JARVIS_DB_MAX_OPEN_CONNS + 2)stays well below the server'smax_connectionsminus its reserved slots — an unbounded pool has exhausted the connection slots of a shared RDS instance in production (FATAL: remaining connection slots are reserved …, SQLSTATE 53300). Ignored for SQLite, which is always single-connection. - Connection poolers (PgBouncer and similar): point
JARVIS_DB_DSNat PostgreSQL directly, or at a pooler in session mode — never transaction mode. Each pod relies on session state that a transaction-mode pooler does not keep on one server connection: the session-level advisory locks (leader election, migration lock) and theLISTENconnections of the WS fanout and the snapshot distribution. In transaction mode a lock outlives the client that took it and notifications are never delivered, so you get no leader, a stuck leader, or followers that never see a new snapshot. The pooler also has to accommodate the dedicated connections counted in the pool-cap bullet above. Jarvis is not tested behind a pooler; direct connections are the supported setup. - Local PostgreSQL for testing:
make up-postgresstarts a disposable container on port 5432 (jarvis/jarvis/jarvis); pointJARVIS_DB_DSN=postgres://jarvis:jarvis@localhost:5432/jarvis?sslmode=disableat it.sslmode=disableis intentional there — it's a local, ephemeral, no-TLS container, never a production target.
High availability & multi-replica (PostgreSQL only)
With replicaCount/HPA > 1 against PostgreSQL, every pod runs the exact same binary — there is no separate "primary" deployment mode. Coordination happens entirely through PostgreSQL; no additional infrastructure (no Redis, no etcd, no client-go/Kubernetes Lease objects) is required.
Leader election
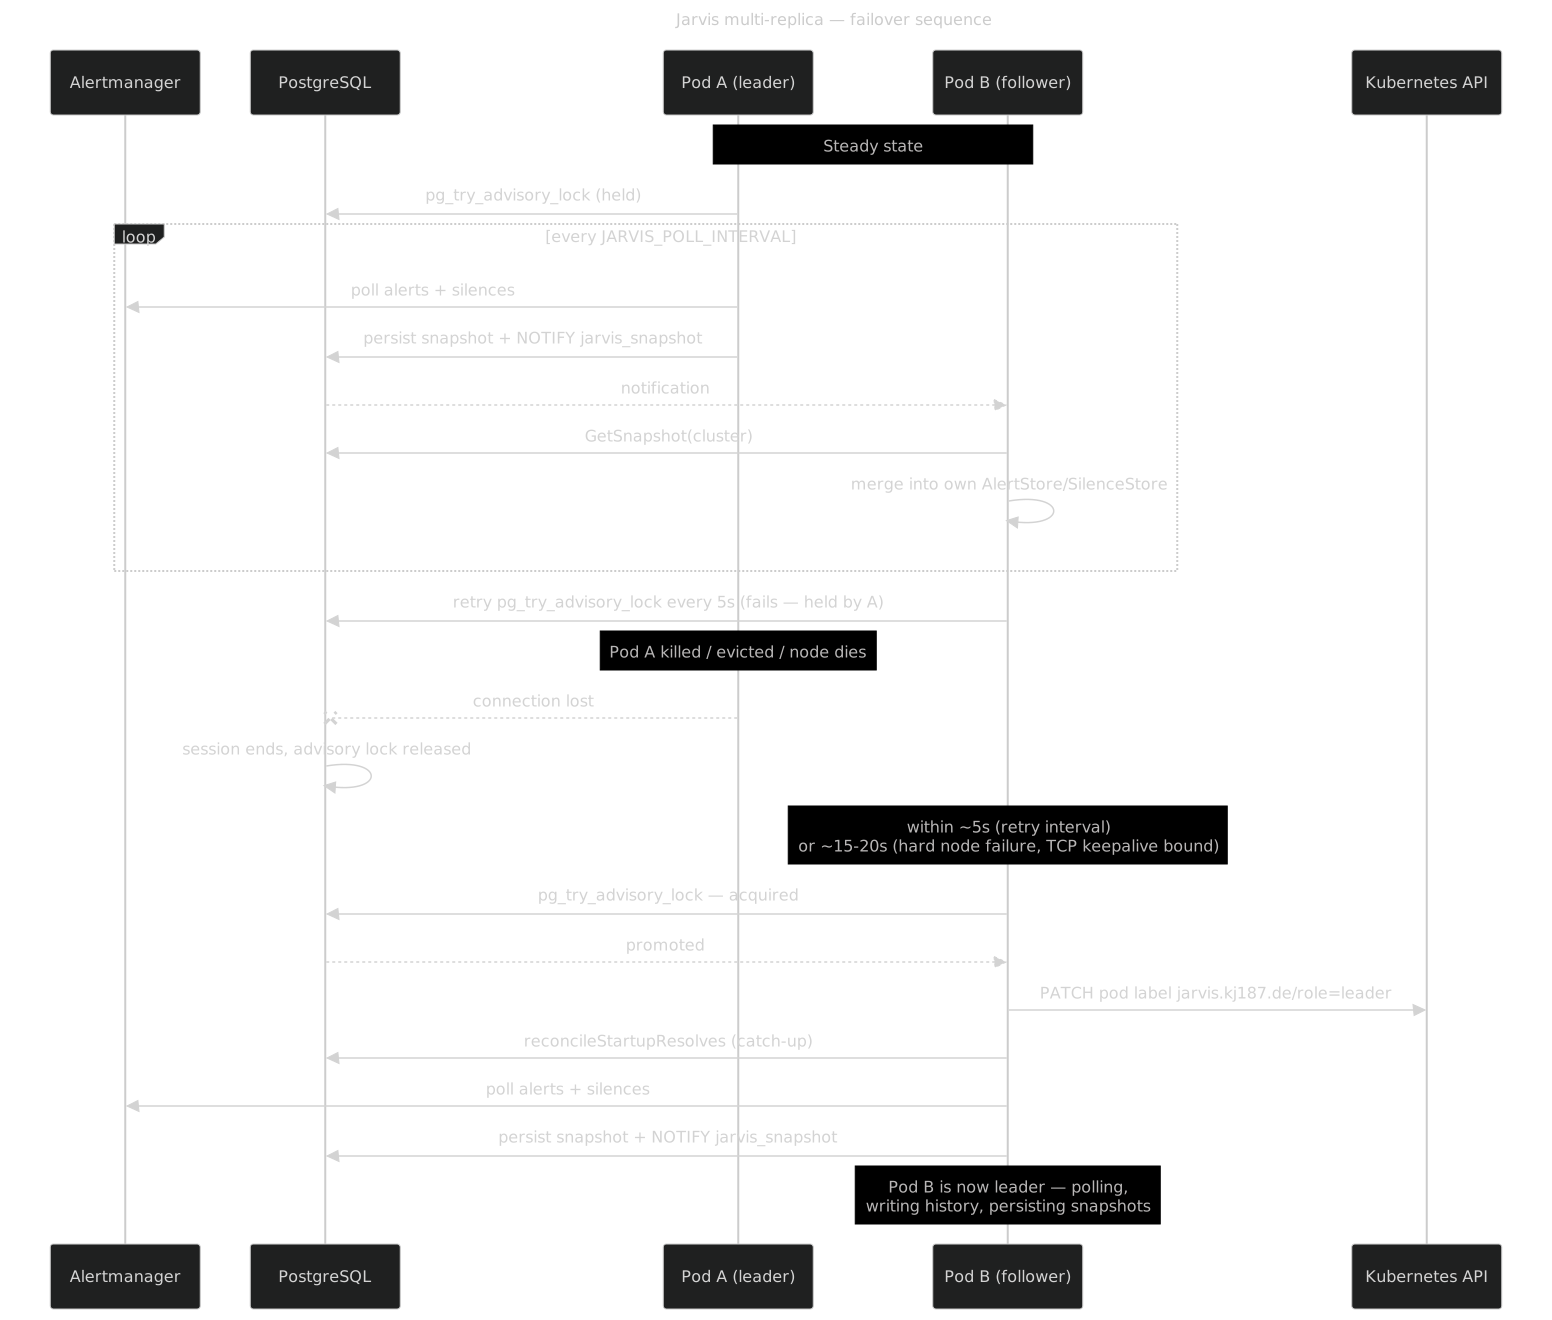
Exactly one pod is leader at any time, decided by a PostgreSQL session-level advisory lock (pg_try_advisory_lock) held on a dedicated connection — not the shared pool, since pool connections get recycled. A pod attempts the lock immediately once its connection is up (so a fresh pod with no incumbent leads within one round-trip), then a follower retries every 5 seconds; the leader heartbeats its own connection on the same interval. Losing the connection (pod killed, network partition, crash) releases the lock automatically — there is no TTL or lease-renewal bookkeeping, PostgreSQL's own session cleanup is the failure detector. The elector's connection uses aggressive TCP keepalives (idle 5s / interval 3s / count 3), and every round-trip on it (connect, heartbeat, try-lock, close) has a deadline of one interval (5s; the connect step takes a connect_timeout from JARVIS_DB_DSN instead, if one is set). TCP keepalive alone is not enough: probes only fire on an idle connection, and a blackholed path leaves the leader's own heartbeat unacknowledged, which the kernel retransmits for minutes. With the deadline, a leader cut off from PostgreSQL steps down after at most one heartbeat interval plus one timeout (about 10s) and stops starting new history writes and polling cycles (see Failover). Work already in flight is not interrupted: a sweep checks leadership only when it starts, and a history transaction that began before the step-down may run to completion (its cap is 30s).
SQLite deployments skip all of this: single replica by design, this pod is always leader.
Leader-only polling & snapshot distribution
Only the leader polls Alertmanager — Alertmanager load does not scale with replicaCount. The leader also owns every history write (event lifecycle, occurrence counts, claim releases, retention sweeps, external-silence event recording).
Followers never poll Alertmanager. Instead, after every poll the leader gzip's a compact per-cluster JSON snapshot (alerts, silences, member up/down state) into the poll_snapshots table and pg_notify('jarvis_snapshot', clusterName). A follower's own rebuild is coalesced rather than run once per notification: it marks the changed cluster and, on the first notification after being idle, waits a fixed 200ms window before resyncing every cluster marked during that window and rebuilding its in-memory stores exactly once — several clusters persisting their poll snapshots within milliseconds of each other (the normal case, since they're all written from the same poll cycle) produce one rebuild, not several. That window never gets pushed back by further notifications, so a continuously notifying cluster still rebuilds at least once per window instead of stalling it indefinitely. Independently of any of that, a full resync also runs on a fixed schedule every JARVIS_POLL_INTERVAL — a genuine fallback for a missed notification even while other clusters keep notifying continuously — so every pod still serves reads, the REST API, and WebSocket pushes to its own connected browsers, from a snapshot that is at most one poll interval old, regardless of which pod happens to be leader right now.
A newly promoted leader starts from the last snapshot of each cluster. If Alertmanager is unreachable at that moment, the cluster keeps showing the alerts of that snapshot instead of going empty on every pod; a cluster Jarvis has never seen is simply not written, so followers show no member state for it. These carried-over alerts are not written to the history; they are resolved normally once Alertmanager answers again. Their age is shown: the header's instance indicator turns yellow and the cluster list says "Stale · 10 min ago" (see Data age below).
Resolved alerts in those snapshots keep the same live-display deadline (JARVIS_RESOLVED_BUFFER_TTL, 20 minutes by default) as on the leader. Every replica must run with the same value: a follower applies its own window to the snapshots it receives, so a shorter value on a follower hides entries the leader still carries, and a longer one cannot bring back entries the leader already dropped. Followers normalize the resolution timestamp, discard already-expired rows while decoding/rebuilding, and physically remove expired entries from both their AlertStore and per-cluster snapshot cache. Promotion never restarts that deadline. Active last-good alerts are not subject to this cleanup, and database history is unchanged.
A pod switching between leader and follower mode (or shutting down) always finishes tearing down its current mode — its poll loop or its follower listener/batch-worker/resync-ticker trio — before the next mode starts, or before the pod considers itself stopped. This closes a possible gap where a just-demoted leader's still-in-flight write could otherwise race a newly started follower rebuild reading the same data.
When a follower rebuilds its alert store from a snapshot it also re-reads the active claims from the shared database and re-attaches them to the merged alerts (the same batched read the leader does each poll). The snapshot only carries the claims that existed as of the leader's last poll, so without this a claim made against any pod would flash in the UI and then disappear until the leader's next poll — and a claim released between leader polls would keep showing on followers just as long.
A user-triggered mutation (creating a silence, for instance) still needs an immediate poll to reconcile against Alertmanager quickly. A follower can't poll itself, so it forwards the request via pg_notify('jarvis_trigger', ''); the leader LISTENs on that channel and treats it exactly like a local trigger.
Cross-pod WebSocket mutation fanout
Comments, claims, and silence mutations are broadcast over WebSocket to whichever pod's browser connections are watching. A mutation handled by one pod publishes the encoded WS message via pg_notify('jarvis_ws', ...) (origin-tagged so a pod never re-delivers its own publish to itself); every other pod is LISTENing and re-broadcasts to its own clients. PostgreSQL's NOTIFY payload limit (~8000 bytes) is handled gracefully: an oversized message (a long comment body, for instance) is replaced by a small reference; the receiving pod refetches the authoritative row from the shared database and reconstructs the exact broadcast — transparent to the browser either way. For a claim set or released, the receiving pod also patches its own in-memory alert store (not just the WebSocket broadcast) — otherwise a browser's REST refetch that load-balances onto that pod before its next snapshot rebuild would briefly show the claim disappearing again. Alert-state broadcasts (alerts_update, the poll-time silences_update) are not fanned out this way — every pod already derives those from its own poll or consumed snapshot.
Each pod's AlertStore caches its own last JSON encoding of the current alert list, invalidated only when the store actually changes, and reuses it for both the unfiltered GET /api/v1/alerts response and the alerts_update WebSocket envelope — so a leader's/follower's poll that changes nothing does not re-marshal or re-broadcast the (potentially large) alert list. This is purely a per-pod encoding cache; it has no bearing on which pod is leader or on the claim-patch requirement above (a claim mutation still bumps the cache, so the patched claim is reflected in the very next cached encoding).
WebSocket delivery is intentionally best-effort per client: each pod's hub keeps a small bounded queue per connected client and a small bounded global broadcast queue. The two kinds of message are bounded differently, because they fail differently. An alerts_update carries the entire alert list, so a newer one makes any still-queued one redundant: at most one is held per client and a newer one replaces it. That caps the memory a single connection can tie up at one alert list, however far behind it falls. Events that carry a change rather than a full picture — a claim, a comment, a silence update — cannot be merged that way, so they queue individually, and a client that stops draining them is disconnected rather than allowed to lose them silently; its existing reconnect-and-refetch converges it back to current state.
A client is therefore only disconnected when it genuinely stops keeping up, not because several events happened close together. This bounds each pod's own WebSocket memory independently of how many browsers are connected or how slow any one of them is; it is unrelated to leader election or snapshot distribution.
User settings
user_settings (one opaque JSON blob per user, internal/settings) is not part of any of the above machinery. Every GET /api/v1/settings reads the row straight from the database — no in-memory cache, so nothing needs invalidating across pods, no leader gating, and no WebSocket fanout, since there is no history side effect to serialize (Critical Invariant #15 does not apply here). The trade-off: two browser tabs of the same user on different pods only converge on the next page load of either tab, not instantly — accepted as out of scope for a personal-preferences row that changes rarely.
Failover
Kill, evict, or drain the leader pod: PostgreSQL releases its session lock (instantly on a graceful shutdown, within seconds of TCP-keepalive detection on a hard failure), a follower acquires it, and immediately:
- Starts polling Alertmanager.
- Runs a one-time startup reconciliation — resolves any alert that actually went away while this pod was a follower (it couldn't record that itself, since only the leader writes history).
- Begins persisting/notifying snapshots for the followers now behind it.
Typical takeover is well under 10 seconds (5s heartbeat + 5s retry interval). After a hard failure two clocks run, and the follower can only acquire the lock once the second has expired:
Old leader (client side): steps down within about 10s of losing the path to PostgreSQL (heartbeat interval + 5s timeout). Covered by
TestPGElector_BlackholedLeaderStepsDownAndFollowerTakesOver: a TCP proxy blackholes the leader's connection, the leader steps down within the bound, the follower takes over only after the server released the session, and the two are never leader at the same time. The test runs at a 300 ms interval (about 0.7 s measured); the 5s production values scale the bound, they were not measured separately."Never two leaders" holds only while the server notices a dead client more slowly than the old leader steps down (roughly twice the heartbeat interval, 10s with the defaults, counting from the cut). If the server's keepalives reap the session faster than that (for example the 20s example below is safe, a 5s detection is not), a follower can take the lock while the old leader still believes it leads, and the two overlap for up to about 10s. Keep the server-side detection time above the client's step-down bound. The 20s example below is safe for the leader flags only: a history transaction that began before the step-down (cap 30s) can still overlap with the new leader. It is serialized only by the per-episode advisory lock (invariant 16), not by leadership.
PostgreSQL server (releases the lock): the session lock is freed only when the server notices its client is gone. On a graceful shutdown or a closed socket that is instant; after a hard node failure it depends on the server's own keepalives. The PostgreSQL default (
tcp_keepalives_idle = 0, i.e. the OS default, usually 2 hours) can hold the lock for hours, so set them on the server (managed services: the parameter group), for exampletcp_keepalives_idle = 10,tcp_keepalives_interval = 3,tcp_keepalives_count = 3, which detects a dead client in about 20s. The takeover time after a hard node failure is that detection time plus up to 5s for the follower's next try. Jarvis cannot shorten it from the client side.
The existing grace-period guarantee (a resolve immediately followed by a re-fire within the poll-scaled grace window reopens the same episode rather than starting a new one) holds across a leadership change exactly as it does on a single replica — the new leader's poll sees the same Alertmanager state a continuously-running single pod would have.
Data age
Jarvis keeps showing the last known alerts of a cluster while Alertmanager is unreachable (and after a leadership change, see above). So that this is never mistaken for live data, every cluster carries the time of its last successful fetch. The leader records it in each snapshot (lastSuccessAt); followers and a newly promoted leader take it from there. A cluster whose last success is older than max(3× JARVIS_POLL_INTERVAL, 60 s) is stale; one that has never answered since this pod started counts from the pod's start. The data is exposed as lastSuccessfulPollAt and stale in GET /api/v1/clusters, as the metrics below, and in the header. Snapshots written by an older version lack the field; the snapshot's own age is used then.
Observability
jarvis_leader(gauge, 0/1) — whether this pod currently holds leadership. Always1on SQLite.jarvis_snapshot_stale(gauge, 0/1) — whether any cluster's last successful Alertmanager fetch is older than max(3×JARVIS_POLL_INTERVAL, 60 s). A leader judges its own polls, a follower the leader's snapshots (so it also fires when notifications and the periodic resync were missed — check the leader's health).jarvis_cluster_last_success_timestamp_seconds{cluster}— Unix time of that cluster's last successful fetch; absent until one succeeded.- Leader-transition log lines and the
leaderfield in theGET /api/v1/statusresponse:json{ "status": "ok", "clusters": 2, "database": "ok", "alerts": 143, "ws_clients": 4, "leader": true, "poll_interval_seconds": 30 }statusis"degraded"(anddatabase"unavailable") while the database does not answer a ping;GET /health/readyreturns503in the same state. A follower reports each cluster's health inGET /api/v1/clustersfrom the last snapshot it consumed, and flags the clusterstaleonce that snapshot is older than the stale threshold.leaderis alwaystrueon SQLite (single replica by design). Unlike/healthand/metrics, this endpoint is not public — it followsJARVIS_AUTH_MODElike any other/api/v1/*route. - Pod label: on Kubernetes, the current leader's pod is labeled
jarvis.kj187.de/role=leaderand the label moves automatically on failover:bashThis is informational only — every pod serves all traffic regardless of leadership, there is no leader-only routing. See Deploy on Kubernetes for the RBAC this needs.kubectl get pods -L jarvis.kj187.de/role
HA topology


Failover sequence
Where to go next
- Deploy on Kubernetes — chart values, the SQLite guard, a CloudNativePG example
- Migrate from SQLite
- Why SQLite stays single-replica